Some helpful slides from a python programming course for atmospheric science purposes:
https://sites.google.com/a/borealscicomp.com/zamg-scientific-python-aug-sep-2014/

Friday, April 29, 2016

Redefine Matplotlib defaults: Plotting Publication Quality Plots
The default python matplotlib settings don't look too good for publication quality work. So here I redefine some of matplotlib's default settings before I make a plot.
(see other parameters you can modify here: http://matplotlib.org/users/customizing.html)
import matplotlib as mpl
# Specify universal figure sizes acceptable for publication
# J.AtmosEnv
# Figure width | Inches wide
# ----------------------+---------------------
# 1/2 page (1 column) | 3.54 in. ( 90 mm)
# 3/4 page (1.5 column) | 5.51 in. (140 mm)
# 1 page (2 column) | 7.48 in. (190 mm)
# ---------------------------------------------
# Image Resolution: line graphs = 1000 dpi
# colorfilled = 500 dpi
# web images = 72 dpi
label_font = 10
tick_font = 8
legend_font = 7
width=3.5
height=3
## Reset the defaults
mpl.rcParams['xtick.labelsize'] = tick_font
mpl.rcParams['ytick.labelsize'] = tick_font
mpl.rcParams['axes.labelsize'] = label_font
mpl.rcParams['legend.fontsize'] = legend_font
mpl.rcParams['figure.figsize'] = [width,height]
mpl.rcParams['grid.linewidth'] = .25
mpl.rcParams['savefig.bbox'] = 'tight'
mpl.rcParams['savefig.dpi'] = 1000
(see other parameters you can modify here: http://matplotlib.org/users/customizing.html)
import matplotlib as mpl
# Specify universal figure sizes acceptable for publication
# J.AtmosEnv
# Figure width | Inches wide
# ----------------------+---------------------
# 1/2 page (1 column) | 3.54 in. ( 90 mm)
# 3/4 page (1.5 column) | 5.51 in. (140 mm)
# 1 page (2 column) | 7.48 in. (190 mm)
# ---------------------------------------------
# Image Resolution: line graphs = 1000 dpi
# colorfilled = 500 dpi
# web images = 72 dpi
label_font = 10
tick_font = 8
legend_font = 7
width=3.5
height=3
## Reset the defaults
mpl.rcParams['xtick.labelsize'] = tick_font
mpl.rcParams['ytick.labelsize'] = tick_font
mpl.rcParams['axes.labelsize'] = label_font
mpl.rcParams['legend.fontsize'] = legend_font
mpl.rcParams['figure.figsize'] = [width,height]
mpl.rcParams['grid.linewidth'] = .25
mpl.rcParams['savefig.bbox'] = 'tight'
mpl.rcParams['savefig.dpi'] = 1000
Friday, April 22, 2016
Python multiprocessing plots
Often I need to create lots of plots. Wouldn't it be great if you could create all the plots at the same time rather than one by one. Summon the multiprocessing module!
##---- Multiprocessing -------------------------------------------------------------------##
## There are a lot of data files for the two days of TDWR data that need to be plotted.
## We want to make these plots really fast, so use the multiprocessing module
## to create a separate plot on each available processor.
## 1) Place the plotting script in a function.
## The input (can only take one) is the file name of the data to be plotted
## 2) In the main program (bottom section of this script)
## a) creat a list of the file names (this simple loop is very fast)
## b) count the number
## c) creat the pool object p = multiprocessing.Pool(num_proc)
## d) send each list item to the plot function with the pool function
## This method makes 475 plots in a few minutes rather than over an hour!!!
##---- Multiprocessing -------------------------------------------------------------------##
import multiprocessing #:)
import matplotlib.pyplot as plt
import numpy as np
#etc.
def make_plot(i):
# i is the name of the file we will open
print i
radar_time = i[8:23]
DATETIME = datetime.datetime.strptime(radar_time,"%Y%m%d_%H%M%S")
mesowest_time = DATETIME.strftime("%Y%m%d%H%M")
string_time = DATETIME.strftime('%d %b %Y %H:%M UTC')
### TDWR Radar Data (converted from .nids to .asc grid)
text = 'SLC_TV0_'+radar_time+'.asc'
this = np.flipud(np.genfromtxt(text,skip_header=6)) #flip the array
# etc. plotting functions
## This is the good stuff...utilizing multiprocessors
if __name__ == '__main__':
# List of file names we want to make plots for
somelist = []
for i in os.listdir('./'):
if i[0:3]=='SLC' and i[-3:]=='asc': # get the file name of a TDWR file for all files
somelist.append(i)
# Count number of processors
num_proc = multiprocessing.cpu_count()
p = multiprocessing.Pool(num_proc)
p.map(make_plot,somelist)
Friday, April 8, 2016
Python: WRF convert data on a staggered grid to mass point.
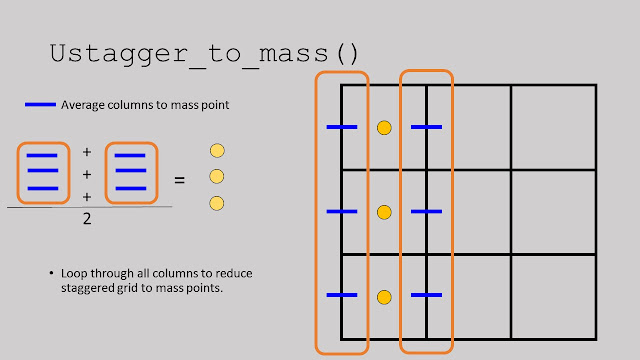
WRF output data has variables on a staggered grid (edges of grid boxes) and variables at a mass point (center of grid box). Sometimes it's necessary to convert the variables on a staggered grid to the mass points so you can plot U and V winds on the same latitude. Here are simple functions to convert the U and V variables on a staggered grid to the mass point grid.
https://github.com/blaylockbk/Ute_WRF/blob/master/functions/stagger_to_mass.py
Below is an explanation of how the function works...


https://github.com/blaylockbk/Ute_WRF/blob/master/functions/stagger_to_mass.py
Below is an explanation of how the function works...


Wednesday, December 16, 2015
Python Transparent Colormap
Transparent color maps are very handy when plotting data on top of other data. If found this little snipped of code...
import matplotlib.colors as mcolors
colors = [(1,0,0,c) for c in np.linspace(0,1,100)]
cmapred = mcolors.LinearSegmentedColormap.from_list('mycmap', colors, N=5)
colors = [(0,0,1,c) for c in np.linspace(0,1,100)]

#
# Plotting WRF netCDF output
# Parts and Pieces of this code is from Luke Madaus (University of Washington)
import sys,getopt
#from netCDF4 import Dataset # use scipy instead
from scipy.io import netcdf
import matplotlib
import matplotlib.pyplot as plt
import numpy as np
import os
from datetime import datetime, timedelta
from mpl_toolkits.basemap import Basemap
from matplotlib.colors import LinearSegmentedColormap
from mpl_toolkits.axes_grid import make_axes_locatable
import matplotlib.axes as maxes
#import mayavi.mlab as mlab #Used for 3d Plotting
import matplotlib.colors as mcolors
from functions_domains_models import *
# Running Script example:
# $ python my_WRF_map.py wrfout_d0x_YYYY-MM-DD_HH:MM:SS
# list of files
#d02 = ['WTDE8Z~0','W2TFAX~5','W1PEFC~6','WKBXUM~Z','WAMGEL~S','WWZHSX~P']
#d02 = ['WKBXUM~Z']
d02 = ['auxhist24_d02_2015-06-17_00:00:00']
spat= 'auxhist23_d02_2015-06-17_00:00:00'
for output_file in d02:
# Open file in a netCDF reader
directory = '/uufs/chpc.utah.edu/common/home/horel-group4/model/bblaylock/WRF3.7_lake303_ember/WRFV3/test/em_real/'
out_dir = '/uufs/chpc.utah.edu/common/home/u0553130/public_html/MS/tracercomposite/'
if not os.path.exists(out_dir):
os.makedirs(out_dir)
wrf_file_name = output_file #NC files are named differently in a windows system
print 'opening', directory+wrf_file_name
nc = netcdf.netcdf_file(directory+wrf_file_name,'r')
nc_spatial = netcdf.netcdf_file(directory+spat,'r')
#-------------------------------------------
# Creat the basemap only once per domain. (This significantly speeds up the plotting speed)
#-------------------------------------------
# x_dim and y_dim are the x and y dimensions of the model
# domain in gridpoints
x_dim = nc.dimensions['west_east']
y_dim = nc.dimensions['south_north']
# Get the grid spacing
dx = float(nc.DX)
dy = float(nc.DY)
width_meters = dx * (x_dim - 1) #Domain Width
height_meters = dy * (y_dim - 1) #Domain Height
""" #Full map
cen_lat = float(nc.CEN_LAT)
cen_lon = float(nc.CEN_LON)
truelat1 = float(nc.TRUELAT1)
truelat2 = float(nc.TRUELAT2)
standlon = float(nc.STAND_LON)
# Draw the base map behind it with the lats and
# lons calculated earlier
m = Basemap(resolution='i',projection='lcc',\
width=width_meters,height=height_meters,\
lat_0=cen_lat,lon_0=cen_lon,lat_1=truelat1,\
lat_2=truelat2)
"""
domain = get_domain('salt_lake_valley')
top_right_lat = domain['top_right_lat']+1
top_right_lon = domain['top_right_lon']+1
bot_left_lat = domain['bot_left_lat']-1
bot_left_lon = domain['bot_left_lon']-1
## Map in cylindrical projection (data points may apear skewed)
m = Basemap(resolution='i',projection='cyl',\
llcrnrlon=bot_left_lon,llcrnrlat=bot_left_lat,\
urcrnrlon=top_right_lon,urcrnrlat=top_right_lat,)
# This sets the standard grid point structure at full resolution
# Converts WRF lat and long to the maps x an y coordinate
XLONG = nc_spatial.variables['XLONG'][0]
XLAT = nc_spatial.variables['XLAT'][0]
x,y = m(XLONG,XLAT)
# Define the colormaps
colors = [(1,0,0,c) for c in np.linspace(0,1,100)]
cmapred = mcolors.LinearSegmentedColormap.from_list('mycmap', colors, N=8)
colors = [(0,0,1,c) for c in np.linspace(0,1,100)]
cmapblue = mcolors.LinearSegmentedColormap.from_list('mycmap', colors, N=8)
for t in np.arange(0,int(np.shape(nc.variables['Times'])[0])):
plt.cla()
plt.clf()
plt.close()
# Grab these variables for now
#landmask = nc.variables['LANDMASK'] # HRRR metgrid landmask
time = ''.join(nc.variables['Times'][t])
time_dt = datetime.strptime(time,'%Y-%m-%d_%H:%M:%S')
time_str= datetime.strftime(time_dt,'%Y-%m-%d %H:%M:%S UTC')
time_str_local=datetime.strftime(time_dt-timedelta(hours=6),'%Y-%m-%d %H:%M:%S MDT')
time_file=datetime.strftime(time_dt,'%Y%m%d%H%M%S')
HGT = nc_spatial.variables['HGT'][0,:,:] #topography
landmask = nc_spatial.variables['LANDMASK'][0,:,:]
plumeN = nc.variables['N_SLV'][t][0]
plumeN_composite = np.sum(nc.variables['N_SLV'][t], axis=0)
plumeS = nc.variables['S_SLV'][t][0]
plumeS_composite = np.sum(nc.variables['S_SLV'][t], axis=0)
#d = nc.variables['tr17_2'][0]
#mlab.contour3d(d)
# This sets a thinn-ed out grid point structure for plotting
# wind barbs at the interval specified in "thin"
#thin = 5
#x_th,y_th = m(XLONG[0,::thin,::thin],XLAT[0,::thin,::thin])
# Set universal figure margins
width = 10
height = 8
plt.figure(t+1)
print 'Plotting',time_str
plt.figure(figsize=(width,height))
"""
plt.rc("figure.subplot", left = .001) #gets rid of white space in plot
plt.rc("figure.subplot", right = .999)
plt.rc("figure.subplot", bottom = .001)
plt.rc("figure.subplot", top = .999)
F = plt.gcf() # Gets the current figure
"""
m.drawstates(color='k', linewidth=1.25)
#m.drawcoastlines(color='k')
#m.drawcountries(color='k', linewidth=1.25)
######################################################
plt.contour(x,y,landmask,levels=[1])
plt.contourf(x,y,HGT,cmap=plt.get_cmap('binary'))
#plt.pcolormesh(x,y,plume,cmap='PuOr', vmin=0,vmax=.01)
plt.pcolormesh(x,y,plumeN_composite,cmap=cmapred,vmax=8,vmin=0)
plt.pcolormesh(x,y,plumeS_composite,cmap=cmapblue,vmax=8,vmin=0)
cbar_loc = plt.colorbar(shrink=.8,pad=.01,ticks= np.arange(0,8,1))
cbar_loc.ax.set_ylabel('Tracers [units of stuff]')
plt.contour(x,y,landmask, [0,1], linewidths=1, colors="k")
#plt.contour(x,y,HGT)
xs,ys = m(-111.97,40.78) #buffr sounding coordinates
plt.scatter(xs,ys, s=70, c='w')
plt.title(time_str+'\n'+time_str_local, bbox=dict(facecolor='white', alpha=0.65),\
x=0.5,y=.90,weight = 'demibold',style='oblique', \
stretch='normal', family='sans-serif')
plt.savefig(out_dir+'TracersComposite_'+time_file+'.png',bbox_inches="tight")
print 'Saved',time_str
#plt.show()
import matplotlib.colors as mcolors
colors = [(1,0,0,c) for c in np.linspace(0,1,100)]
cmapred = mcolors.LinearSegmentedColormap.from_list('mycmap', colors, N=5)
colors = [(0,0,1,c) for c in np.linspace(0,1,100)]
cmapblue = mcolors.LinearSegmentedColormap.from_list('mycmap', colors, N=5)
Then you can assign the colormap in your plot
plt.contourf(x,y,z,cmap=cmapred)
plt.colormesh(x,y,z,cmap=cmapblue)
You may need to adjust the levels to get the scale right in the contours.
Here's an example of my transparent colormap showing pollution tracers blowing around northern Utah from Salt Lake County...

Below is how I made the above plot...
# Brian Blaylock#
# Plotting WRF netCDF output
# Parts and Pieces of this code is from Luke Madaus (University of Washington)
import sys,getopt
#from netCDF4 import Dataset # use scipy instead
from scipy.io import netcdf
import matplotlib
import matplotlib.pyplot as plt
import numpy as np
import os
from datetime import datetime, timedelta
from mpl_toolkits.basemap import Basemap
from matplotlib.colors import LinearSegmentedColormap
from mpl_toolkits.axes_grid import make_axes_locatable
import matplotlib.axes as maxes
#import mayavi.mlab as mlab #Used for 3d Plotting
import matplotlib.colors as mcolors
from functions_domains_models import *
# Running Script example:
# $ python my_WRF_map.py wrfout_d0x_YYYY-MM-DD_HH:MM:SS
# list of files
#d02 = ['WTDE8Z~0','W2TFAX~5','W1PEFC~6','WKBXUM~Z','WAMGEL~S','WWZHSX~P']
#d02 = ['WKBXUM~Z']
d02 = ['auxhist24_d02_2015-06-17_00:00:00']
spat= 'auxhist23_d02_2015-06-17_00:00:00'
for output_file in d02:
# Open file in a netCDF reader
directory = '/uufs/chpc.utah.edu/common/home/horel-group4/model/bblaylock/WRF3.7_lake303_ember/WRFV3/test/em_real/'
out_dir = '/uufs/chpc.utah.edu/common/home/u0553130/public_html/MS/tracercomposite/'
if not os.path.exists(out_dir):
os.makedirs(out_dir)
wrf_file_name = output_file #NC files are named differently in a windows system
print 'opening', directory+wrf_file_name
nc = netcdf.netcdf_file(directory+wrf_file_name,'r')
nc_spatial = netcdf.netcdf_file(directory+spat,'r')
#-------------------------------------------
# Creat the basemap only once per domain. (This significantly speeds up the plotting speed)
#-------------------------------------------
# x_dim and y_dim are the x and y dimensions of the model
# domain in gridpoints
x_dim = nc.dimensions['west_east']
y_dim = nc.dimensions['south_north']
# Get the grid spacing
dx = float(nc.DX)
dy = float(nc.DY)
width_meters = dx * (x_dim - 1) #Domain Width
height_meters = dy * (y_dim - 1) #Domain Height
""" #Full map
cen_lat = float(nc.CEN_LAT)
cen_lon = float(nc.CEN_LON)
truelat1 = float(nc.TRUELAT1)
truelat2 = float(nc.TRUELAT2)
standlon = float(nc.STAND_LON)
# Draw the base map behind it with the lats and
# lons calculated earlier
m = Basemap(resolution='i',projection='lcc',\
width=width_meters,height=height_meters,\
lat_0=cen_lat,lon_0=cen_lon,lat_1=truelat1,\
lat_2=truelat2)
"""
domain = get_domain('salt_lake_valley')
top_right_lat = domain['top_right_lat']+1
top_right_lon = domain['top_right_lon']+1
bot_left_lat = domain['bot_left_lat']-1
bot_left_lon = domain['bot_left_lon']-1
## Map in cylindrical projection (data points may apear skewed)
m = Basemap(resolution='i',projection='cyl',\
llcrnrlon=bot_left_lon,llcrnrlat=bot_left_lat,\
urcrnrlon=top_right_lon,urcrnrlat=top_right_lat,)
# This sets the standard grid point structure at full resolution
# Converts WRF lat and long to the maps x an y coordinate
XLONG = nc_spatial.variables['XLONG'][0]
XLAT = nc_spatial.variables['XLAT'][0]
x,y = m(XLONG,XLAT)
# Define the colormaps
colors = [(1,0,0,c) for c in np.linspace(0,1,100)]
cmapred = mcolors.LinearSegmentedColormap.from_list('mycmap', colors, N=8)
colors = [(0,0,1,c) for c in np.linspace(0,1,100)]
cmapblue = mcolors.LinearSegmentedColormap.from_list('mycmap', colors, N=8)
for t in np.arange(0,int(np.shape(nc.variables['Times'])[0])):
plt.cla()
plt.clf()
plt.close()
# Grab these variables for now
#landmask = nc.variables['LANDMASK'] # HRRR metgrid landmask
time = ''.join(nc.variables['Times'][t])
time_dt = datetime.strptime(time,'%Y-%m-%d_%H:%M:%S')
time_str= datetime.strftime(time_dt,'%Y-%m-%d %H:%M:%S UTC')
time_str_local=datetime.strftime(time_dt-timedelta(hours=6),'%Y-%m-%d %H:%M:%S MDT')
time_file=datetime.strftime(time_dt,'%Y%m%d%H%M%S')
HGT = nc_spatial.variables['HGT'][0,:,:] #topography
landmask = nc_spatial.variables['LANDMASK'][0,:,:]
plumeN = nc.variables['N_SLV'][t][0]
plumeN_composite = np.sum(nc.variables['N_SLV'][t], axis=0)
plumeS = nc.variables['S_SLV'][t][0]
plumeS_composite = np.sum(nc.variables['S_SLV'][t], axis=0)
#d = nc.variables['tr17_2'][0]
#mlab.contour3d(d)
# This sets a thinn-ed out grid point structure for plotting
# wind barbs at the interval specified in "thin"
#thin = 5
#x_th,y_th = m(XLONG[0,::thin,::thin],XLAT[0,::thin,::thin])
# Set universal figure margins
width = 10
height = 8
plt.figure(t+1)
print 'Plotting',time_str
plt.figure(figsize=(width,height))
"""
plt.rc("figure.subplot", left = .001) #gets rid of white space in plot
plt.rc("figure.subplot", right = .999)
plt.rc("figure.subplot", bottom = .001)
plt.rc("figure.subplot", top = .999)
F = plt.gcf() # Gets the current figure
"""
m.drawstates(color='k', linewidth=1.25)
#m.drawcoastlines(color='k')
#m.drawcountries(color='k', linewidth=1.25)
######################################################
plt.contour(x,y,landmask,levels=[1])
plt.contourf(x,y,HGT,cmap=plt.get_cmap('binary'))
#plt.pcolormesh(x,y,plume,cmap='PuOr', vmin=0,vmax=.01)
plt.pcolormesh(x,y,plumeN_composite,cmap=cmapred,vmax=8,vmin=0)
plt.pcolormesh(x,y,plumeS_composite,cmap=cmapblue,vmax=8,vmin=0)
cbar_loc = plt.colorbar(shrink=.8,pad=.01,ticks= np.arange(0,8,1))
cbar_loc.ax.set_ylabel('Tracers [units of stuff]')
plt.contour(x,y,landmask, [0,1], linewidths=1, colors="k")
#plt.contour(x,y,HGT)
xs,ys = m(-111.97,40.78) #buffr sounding coordinates
plt.scatter(xs,ys, s=70, c='w')
plt.title(time_str+'\n'+time_str_local, bbox=dict(facecolor='white', alpha=0.65),\
x=0.5,y=.90,weight = 'demibold',style='oblique', \
stretch='normal', family='sans-serif')
plt.savefig(out_dir+'TracersComposite_'+time_file+'.png',bbox_inches="tight")
print 'Saved',time_str
#plt.show()
Subscribe to:
Posts (Atom)