Is it possible to add a new field in a numpy.genfromtxt output? Yes it is. I asked this question on stackoverflow and got an answer that works...
http://stackoverflow.com/questions/40182466/is-it-possible-to-add-a-new-field-in-a-numpy-genfromtxt-output/40183748#40183748
The trick is using the numpy.lib.recfunctions library. Use the append_fields function to add a new field to a data structure.
This page demonstrates Python tips and tricks that I use in my everyday programming as an atmospheric science graduate student.
-Brian Blaylock
Friday, October 21, 2016
Monday, October 10, 2016
Plotting maps with a loop: Best Practices
Best practices for plotting data on a map with a loop...
If you want to plot many data sets with different times on a base map, only plot the base map once!
Some psudo code:
fig = plt.figure(1)
ax = fig.add_subplot(111)
## Draw Background basemap
m = Basemap(resolution='i',projection='cyl',\
llcrnrlon=bot_left_lon,llcrnrlat=bot_left_lat,\
urcrnrlon=top_right_lon,urcrnrlat=top_right_lat,)
m.drawcoastlines()
m.drawcountries()
m.drawcounties()
m.drawstates()
# Brackground image from GIS
m.arcgisimage(service='NatGeo_World_Map', xpixels = 1000, dpi=100)
# Add a shape file for Fire perimiter
p4 = m.readshapefile('/uufs/chpc.utah.edu/common/home/u0553130/fire_shape/perim_'+perimiter,'perim',drawbounds=False)
# Plot station locations
m.scatter(lons,lats)
plt.text(lons[0],lats[0],stnid[0])
plt.text(lons[1],lats[1],stnid[1])
for analysis_h in range(1,5):
# code to get lat/lon and data
# plot pcolormesh, and colorbar
PC = m.pcolormesh(lon,lat,data)
cbar = plt.colorbar(orientation='horizontal',pad=0.05,shrink=.8,ticks=range(0,80,5))
# plot contour
CC = m.contour(lon,lat,data)
# plot HRRR 10-m winds
WB = m.barbs(lon,lat,u,v,)
### Before you plot the next loop, remove the data plots
cbar.remove() # remove colorbar
PC.remove() # remove pcolomesh
WB[0].remove() #remove wind barbs
WB[1].remove() # (takes two steps)
for cc in CC.collections: #remove each line in the contour collection
cc.remove()
Thursday, October 6, 2016
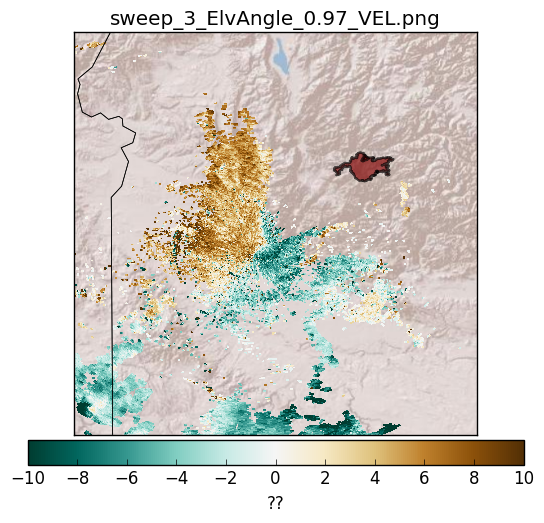
Plot NEXRAD Level II Data with MetPy
Plotting NEXRAD Level II data is possible using MetPy.
View my script here: https://github.com/blaylockbk/Ute_other/blob/master/plot_NEXRAD_II_data.py
Example:
View my script here: https://github.com/blaylockbk/Ute_other/blob/master/plot_NEXRAD_II_data.py
Example:
Plotting the fire perimeter from a shape file
There is very useful documentation related to plotting shape files on a basemap here: http://basemaptutorial.readthedocs.io/en/latest/shapefile.html
I needed to plot fire perimeter, plotted on this map of Idaho and shaded in red, on a basemap.
This is how I did it...
from matplotlib.patches import Polygon
from matplotlib.collections import PatchCollection
## My file
# Plot Fire Perimeter
perimiter = '160806'
p4 = m.readshapefile('[PATH]/perim_'+perimiter,'perim',drawbounds=False)
patches = []
for info, shape in zip(m.perim_info, m.perim):
if info['FIRENAME'] == 'PIONEER' and info['SHAPENUM']==1772:
x, y = zip(*shape)
#print info
#m.plot(x, y, marker=None,color='maroon',linewidth=2)
patches.append(Polygon(np.array(shape), True) )
ax.add_collection(PatchCollection(patches, facecolor= 'maroon', alpha=.65, edgecolor='k', linewidths=1.5, zorder=1))
Subscribe to:
Posts (Atom)


